Performance analysis of iSulad with Callgrind and QCachegrind
[TOC]
Use Callgrind generate profile data file for iSulad
As with Cachegrind, you probably want to compile with debugging info (the -g option) and with optimization turned on.
To start a profile run for a program, execute:
valgrind --tool=callgrind [callgrind options] your-program [program options]
############################################ terminal one ######################################################
~ ❯ dnf install valgrind graphviz
~ ❯ pip3 install gprof2dot
~ ❯ cat valgrind_isulad.sh
cd /root/workspace/lxc
sed -i 's/fd == STDIN_FILENO || fd == STDOUT_FILENO || fd == STDERR_FILENO/fd == 0 || fd == 1 || fd == 2 || fd >= 1000/g' ./src/lxc/start.c
./autogen.sh && ./configure --enable-debug=yes && make -j && make install && ldconfig

cd /root/workspace/lcr
sed -i 's/fd == STDIN_FILENO || fd == STDOUT_FILENO || fd == STDERR_FILENO/fd == 0 || fd == 1 || fd == 2 || fd >= 1000/g' ./src/utils.c
cd build && cmake -DCMAKE_BUILD_TYPE=Debug ../ && make -j && make install && ldconfig

cd /root/workspace/iSulad
sed -i 's/fd == STDIN_FILENO || fd == STDOUT_FILENO || fd == STDERR_FILENO/fd == 0 || fd == 1 || fd == 2 || fd >= 1000/g' ./src/utils/cutils/utils.c
cd build && cmake -DCMAKE_BUILD_TYPE=Debug ../ && make -j && make install && ldconfig
# https://valgrind.org/docs/manual/cl-manual.html
# If you are running a multi-threaded application and specify the command line option --separate-threads=yes, every thread will be profiled on its own and will create its own profile dump
~/profiles ❯ valgrind --dsymutil=yes --separate-threads=yes --tool=callgrind isulad
############################################ terminal two ######################################################
# Do some operations you need to perform performance analysis.
# For example, I want to do performance analysis of isula exec streaming:
~ ❯ isula exec -it fd27dc5c8d9d dd if=/dev/zero of=/home/testdata bs=1M count=500
500+0 records in
500+0 records out
524288000 bytes (524 MB, 500 MiB) copied, 0.407749 s, 1.3 GB/s
~ ❯ isula exec -it fd27dc5c8d9d cat /home/testdata > testdata
# ...
# List the thread of iSulad, which will be used in later analysis
~ ❯ ps -T -p `cat /var/run/isulad.pid`
  PID  SPID TTY          TIME CMD
16130 16130 pts/0    00:00:02 isulad
16130 16131 pts/0    00:00:00 Log_gather
16130 16133 pts/0    00:00:00 Shutdown
16130 16134 pts/0    00:00:00 Clients_checker
16130 16135 pts/0    00:00:00 Monitored
16130 16136 pts/0    00:00:00 Supervisor
16130 16137 pts/0    00:00:00 Garbage_collect
16130 16139 pts/0    00:00:00 isulad
16130 16140 pts/0    00:00:00 default-executo
16130 16141 pts/0    00:00:00 resolver-execut
16130 16142 pts/0    00:00:00 grpc_global_tim
16130 16143 pts/0    00:00:00 grpcpp_sync_ser
16130 16144 pts/0    00:00:00 isulad
16130 16151 pts/0    00:00:00 grpc_global_tim
16130 16196 pts/0    00:00:00 grpcpp_sync_ser
Back to terminal one
############################################ terminal one ######################################################
~/profiles ❯ valgrind --tool=callgrind --separate-threads=yes --dsymutil=yes isulad
==15672== Callgrind, a call-graph generating cache profiler
==15672== Copyright (C) 2002-2017, and GNU GPL'd, by Josef Weidendorfer et al.
==15672== Using Valgrind-3.15.0 and LibVEX; rerun with -h for copyright info
==15672== Command: isulad
==15672==
==15672== For interactive control, run 'callgrind_control -h'.
engine 20201127070950.463 ERROR /root/workspace/iSulad/src/utils/cutils/utils_fs.c:try_probe_overlay_module:187 - modprobe overlay exec failed: [], ["modprobe: FATAL: Module overlay not found in directory /lib/modules/4.19.84-microsoft-standard\n"
......
iSula 20201127071024.801 - Event: {Object: fd27dc5c8d9d2a5d2bc462dd22854c2f0dd430a253013a327797e88ff797ace3, Type: container exec_die (pid=22363, image=fedora, name=fd27dc5c8d9d2a5d2bc462dd22854c2f0dd430a253013a327797e88ff797ace3, maintainer=Clement Verna <cverna@fedoraproject.org>)}
^C==15672==
==15672== Events : Ir
==15672== Collected : 262644136
==15672==
==15672== I refs: 262,644,136
# After the test in terminal two, you can send it Control-C to the valgrind process directly, a profile data file named callgrind.out.<pid>(callgrind.out.pid.part-threadID: "-threadID" is only used if you request dumps of individual threads with --separate-threads=yes) is generated, where pid is the process ID of the program being profiled. The data file contains information about the calls made in the program among the functions executed, together with Instruction Read (Ir) event counts.
~/profiles ❯ ll
rw------- 1 root root 0 B Fri Nov 27 15:24:20 2020 callgrind.out.16130
rw------- 1 root root 1 MiB Fri Nov 27 15:26:04 2020 callgrind.out.16130-01
rw------- 1 root root 17 KiB Fri Nov 27 15:26:04 2020 callgrind.out.16130-02
rw------- 1 root root 51 KiB Fri Nov 27 15:26:04 2020 callgrind.out.16130-03
rw------- 1 root root 4 KiB Fri Nov 27 15:26:04 2020 callgrind.out.16130-04
rw------- 1 root root 48 KiB Fri Nov 27 15:26:04 2020 callgrind.out.16130-05
rw------- 1 root root 3 KiB Fri Nov 27 15:26:04 2020 callgrind.out.16130-06
rw------- 1 root root 4 KiB Fri Nov 27 15:26:04 2020 callgrind.out.16130-07
rw------- 1 root root 22 KiB Fri Nov 27 15:26:04 2020 callgrind.out.16130-08
rw------- 1 root root 15 KiB Fri Nov 27 15:26:04 2020 callgrind.out.16130-09
rw------- 1 root root 8 KiB Fri Nov 27 15:26:05 2020 callgrind.out.16130-10
rw------- 1 root root 22 KiB Fri Nov 27 15:26:05 2020 callgrind.out.16130-11
rw------- 1 root root 497 KiB Fri Nov 27 15:26:05 2020 callgrind.out.16130-12
rw------- 1 root root 18 KiB Fri Nov 27 15:26:05 2020 callgrind.out.16130-13
rw------- 1 root root 403 KiB Fri Nov 27 15:26:05 2020 callgrind.out.16130-14
rw------- 1 root root 15 KiB Fri Nov 27 15:26:05 2020 callgrind.out.16130-15
rw------- 1 root root 21 KiB Fri Nov 27 15:26:05 2020 callgrind.out.16130-16
rw------- 1 root root 45 KiB Fri Nov 27 15:26:05 2020 callgrind.out.16130-17
~/profiles ❯
~ ❯ pid=16130
# Generate performance analysis report and graph prictures with gprof2dot & graphviz(dot), but another more recommended way is to use {K,Q}Cachegrind for visual analysis, which will be introduced later.
~ ❯ for profile in $(find . -name "callgrind.out.${pid}-*" -maxdepth 1); do thread=$(echo ${profile} | awk -F "-" '{print $NF}'); gprof2dot -f callgrind -n10 -s callgrind.out.${pid}-${thread} > isulad-valgrind-${thread}.dot; done
~ ❯ for dotfile in $(find . -name "isulad-valgrind-*" -maxdepth 1); do thread=$(echo ${dotfile} | awk -F "-" '{print $NF}' | awk -F "." '{print $1}'); dot -Tpng isulad-valgrind-${thread}.dot -o isulad-valgrind-${thread}.png; done
# Now, you can browse the generated images for analysis...
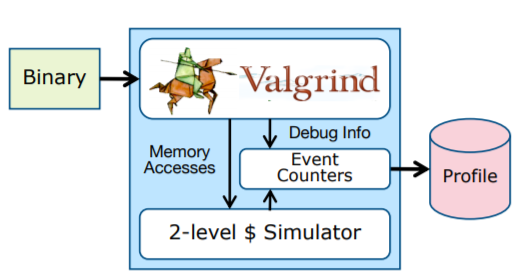
{K,Q}Cachegrind visualizes profile measurement data
{K,Q}Cachegrind is a KDE/Qt GUI to visualize profiling data measured by Cachegrind/Callgrind tools from the Valgrind package. Callgrind uses runtime instrumentation via the Valgrind framework for its cache simulation and call-graph generation. This way, even shared libraries and dynamically opened plugins can be profiled. The data files generated by Callgrind can be loaded into KCachegrind for browsing the performance results.
After a profile information file has been generated you can open it with KCacheGrind (Linux, KDE) or QCacheGrind (Windows):
Click the Open button in File menu, which will pop up the File Open Dialog to choose a profile data file (callgrind.out.pid.part-threadID) to be loaded.
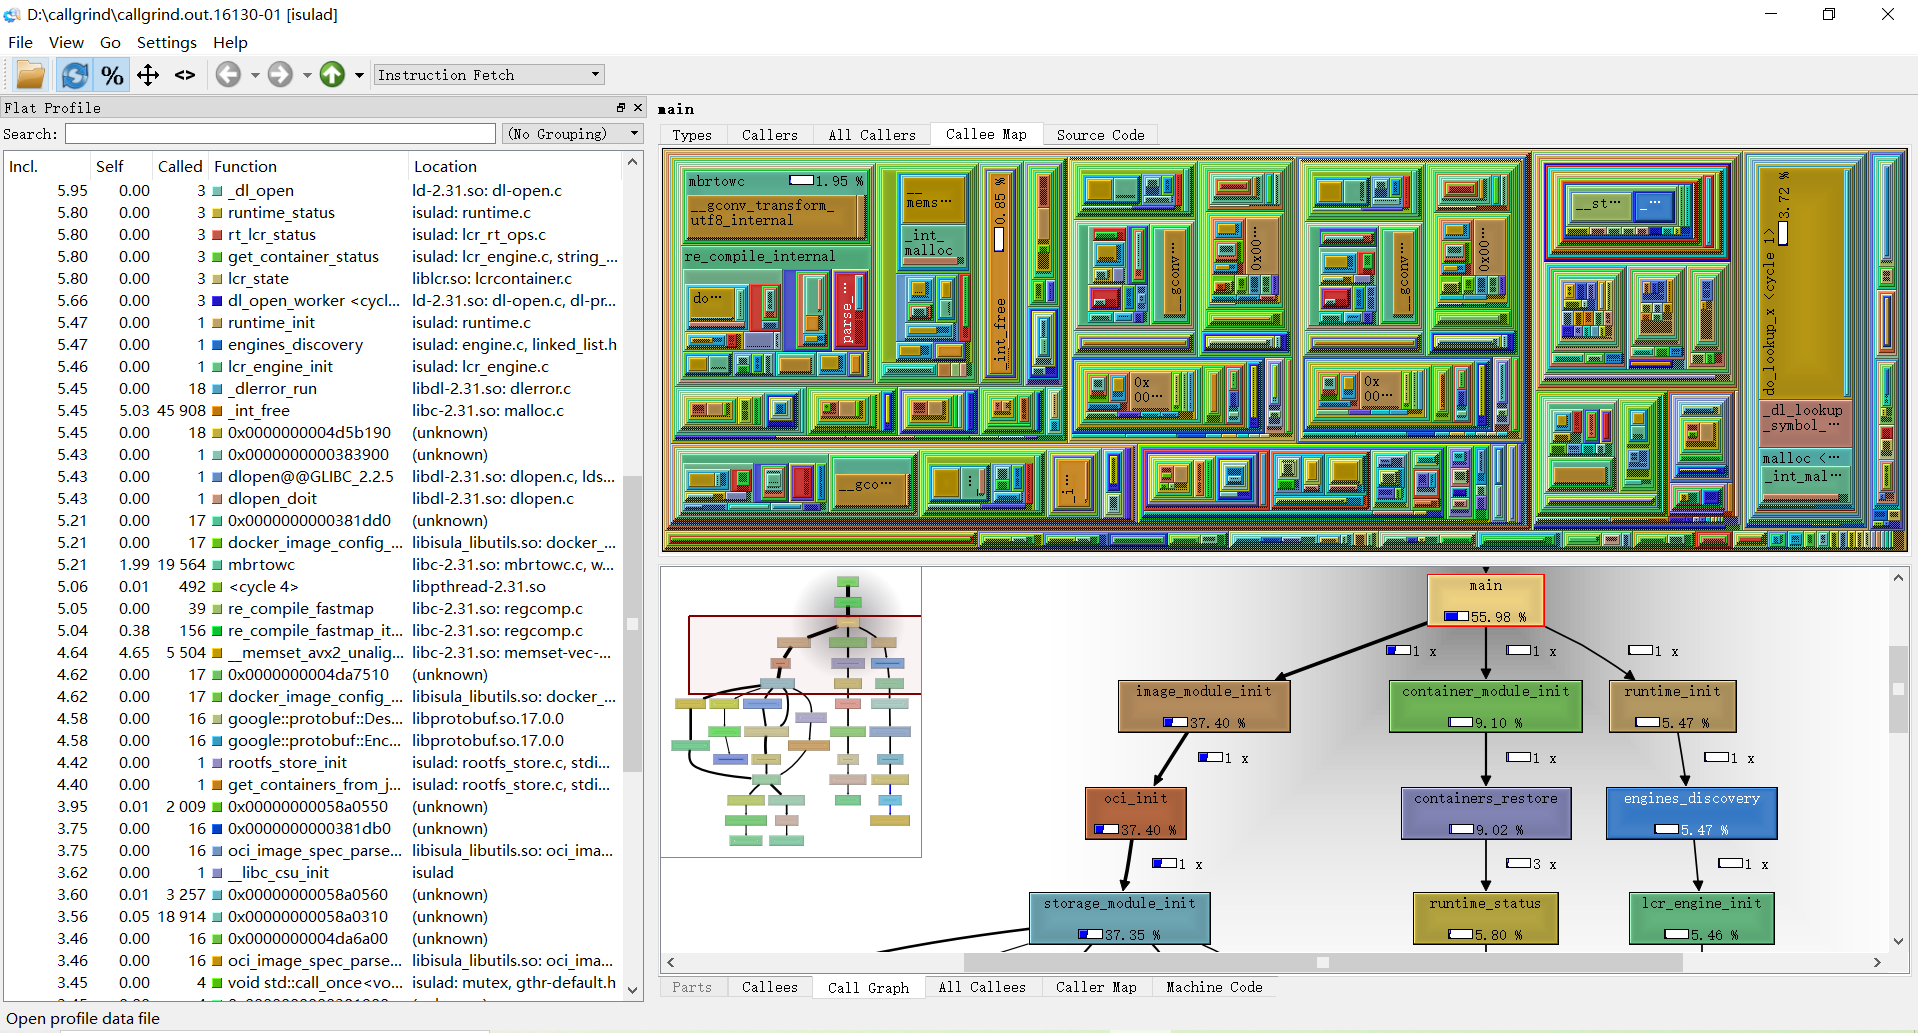
On the left side you find the "Flat Profile" pane showing all cost types available and the corresponding self and inclusive cost of the current active function for that event type. The second column "Self" shows the time spent in this function (without its children), the third column "Called" shows how often a specific function was called and the last column "Function" shows the name of the function.
The numbers in the first two columns can be either percentages of the full running time of the script or absolute time (1 unit is 1/1.000.000th of a second). You can switch between the two modes with the button "%" in menu.
The pane on the right contains an upper and lower pane. The upper one shows information about which functions called the current selected function. The lower pane shows information about the functions that the current selected function called. The "Ir" column in the upper pane shows the time spent in the current selected function while being called from the function in the list. The "Ir" column in the lower pane shows the time spent while calling the function from the list. While adding the numbers in this list up, you will most likely never reach the value of "Ir" in upper pane, as the selected function itself will also takes time to execute.
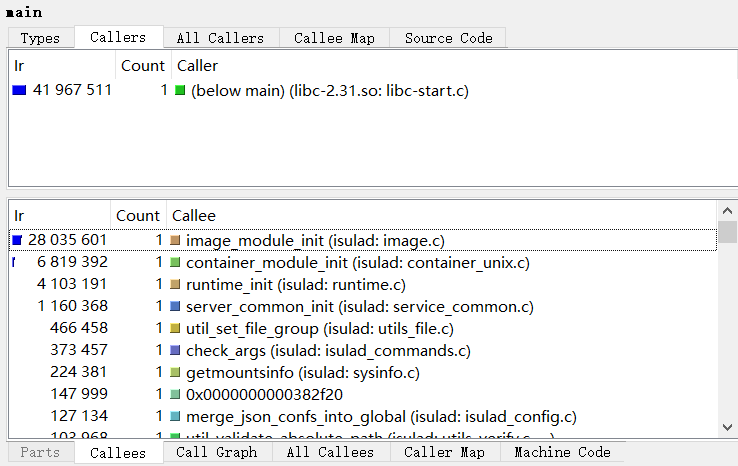
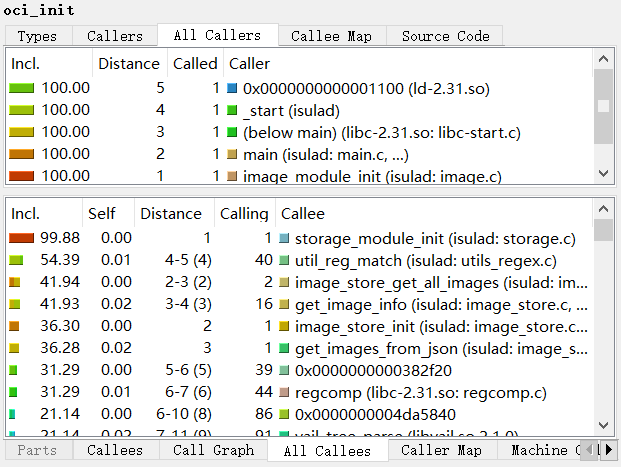
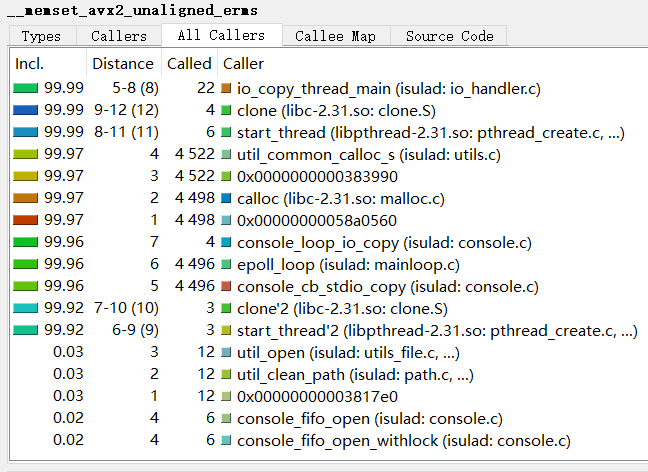
The "All Callers" and "All Callees" tabs show not only the direct calls from which the function was called respectively all directly made function calls but also function calls made more levels up and down. The upper pane in the screenshot on the left shows all functions calling the current selected one, both directly and indirectly with other functions inbetween them on the stack. The "Distance" column shows how many function calls are between the listed and the current selected one (-1). If there are different distances between two functions, it is shown as a range (for example "2-3"). The number in parentheses is the median distance. The lower pane is similar except that it shows information on functions called from the current selected one, again either direct or indirect. The " Callers" and "Callees" tabs only the direct calls and functions called.
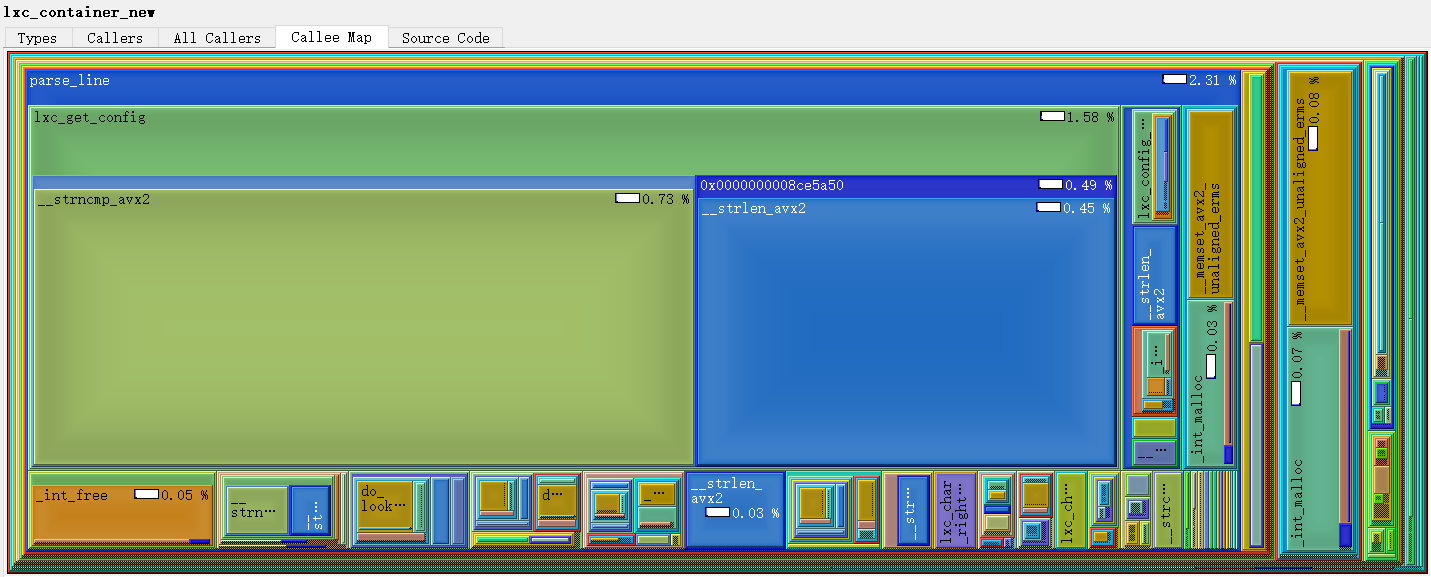
The "Callee Map" tabs show a treemap visualization of the primary event type, up or down the call hierarchy. Each colored rectangle represents a function; its size tries to be proportional to the cost spent therein while the active function is running (however, there are drawing constrains).
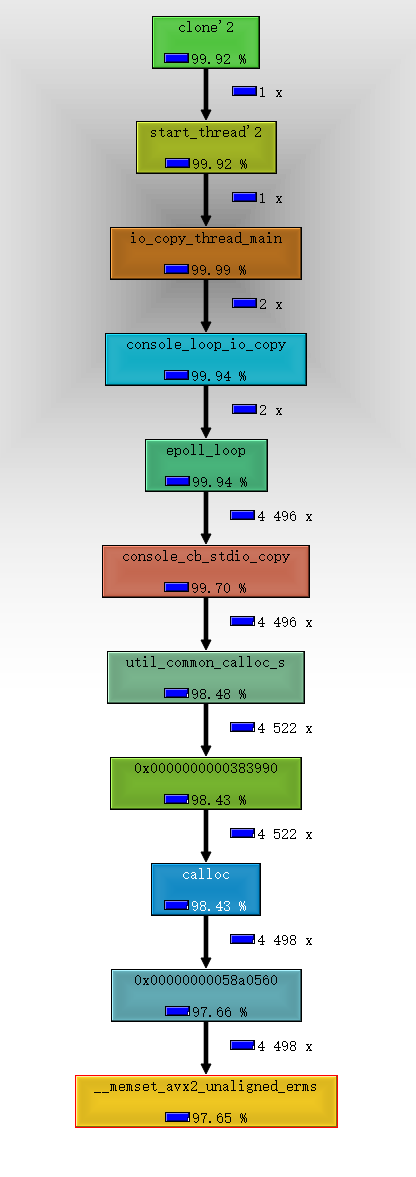
The "Call Graph" tabs show the call graph around the active function. The shown cost is only the cost which is spent while the active function was actually running; i.e. the cost shown for oci_init- if it's visible - should be the same as the cost of the active function, as that is the part of inclusive cost of oci_init spent while the active function was running. For cycles, blue call arrows indicate that this is an artificial call added for correct drawing which actually never happened.
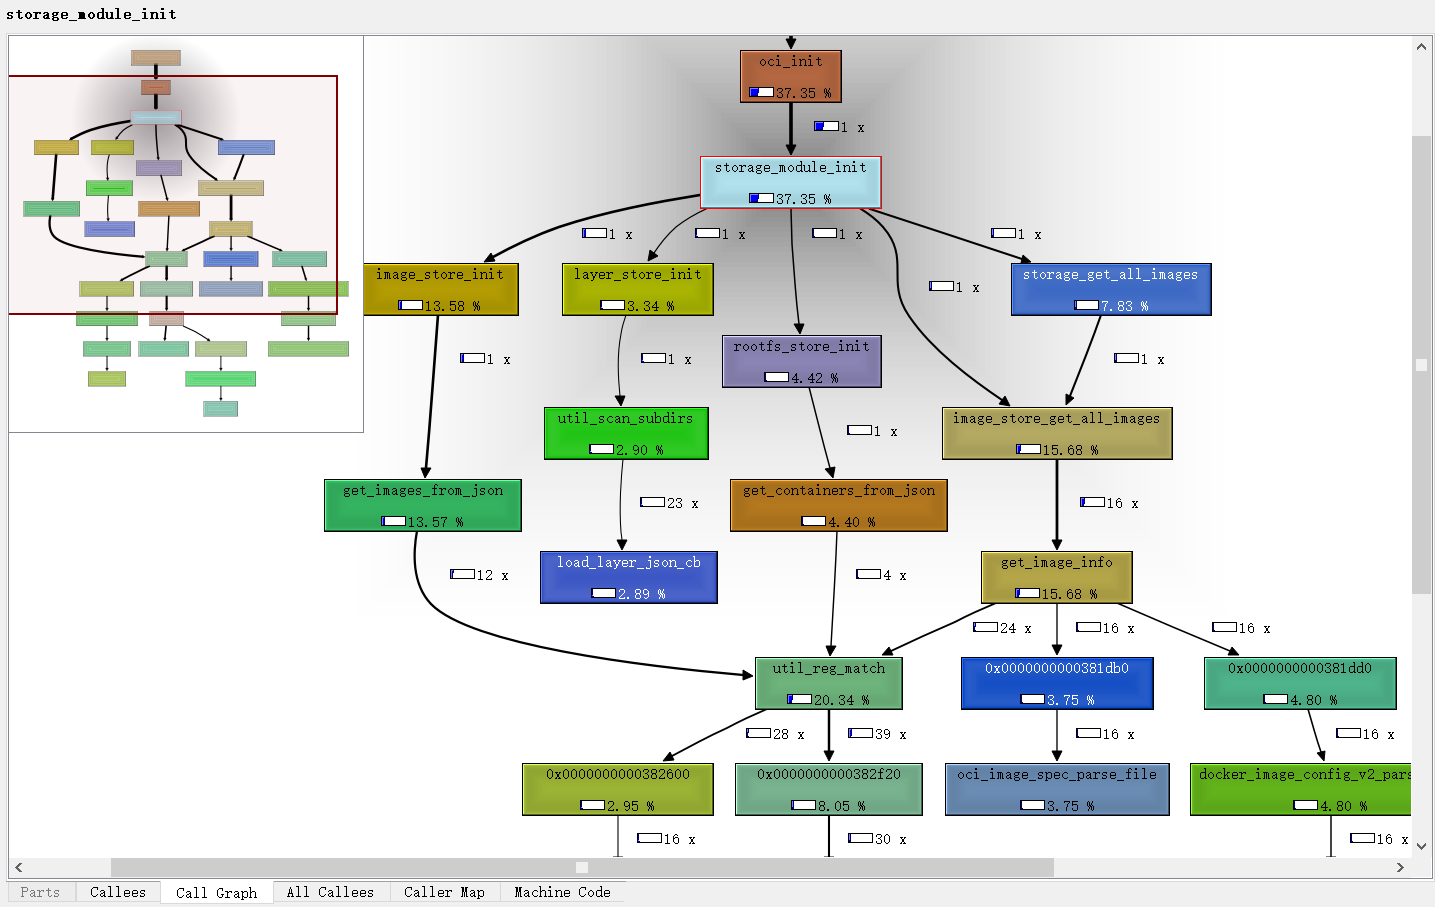
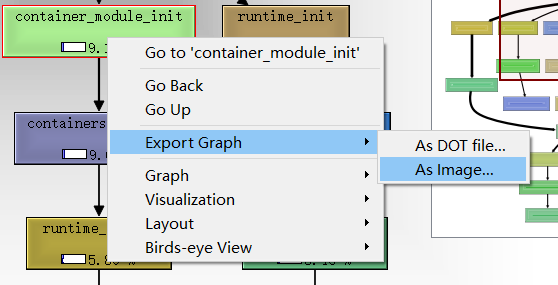
If the graph is larger than the widget area, an overview panner is shown in one edge. There are similar visualization options as for the Call Treemap; the selected function is highlighted. You can also export the Graph as image and open it with the picture browser.
Analysing Profiles
As we can see, the memset function occupies 97.69% of the program overhead and consumes itself.
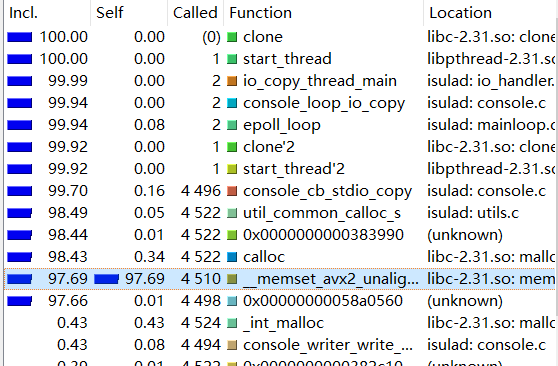
But the memset function has no room for optimization,so we can check which functions call memset and whether it can be optimized.
In Call Graph view, we can also see that a large amount of CPU is consumed in the memset function.
Solution
- memory pool